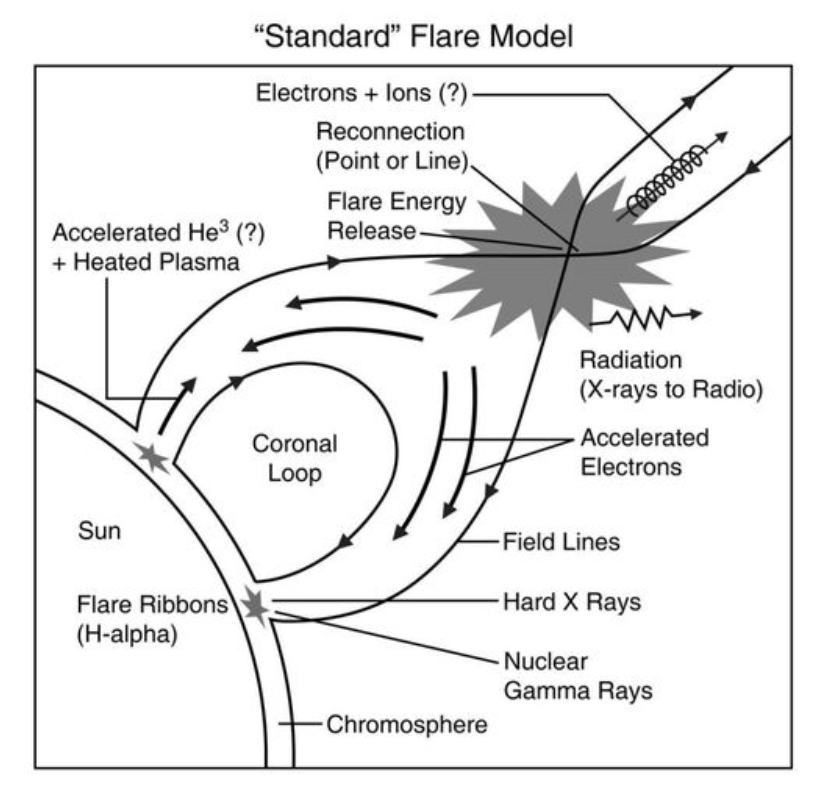
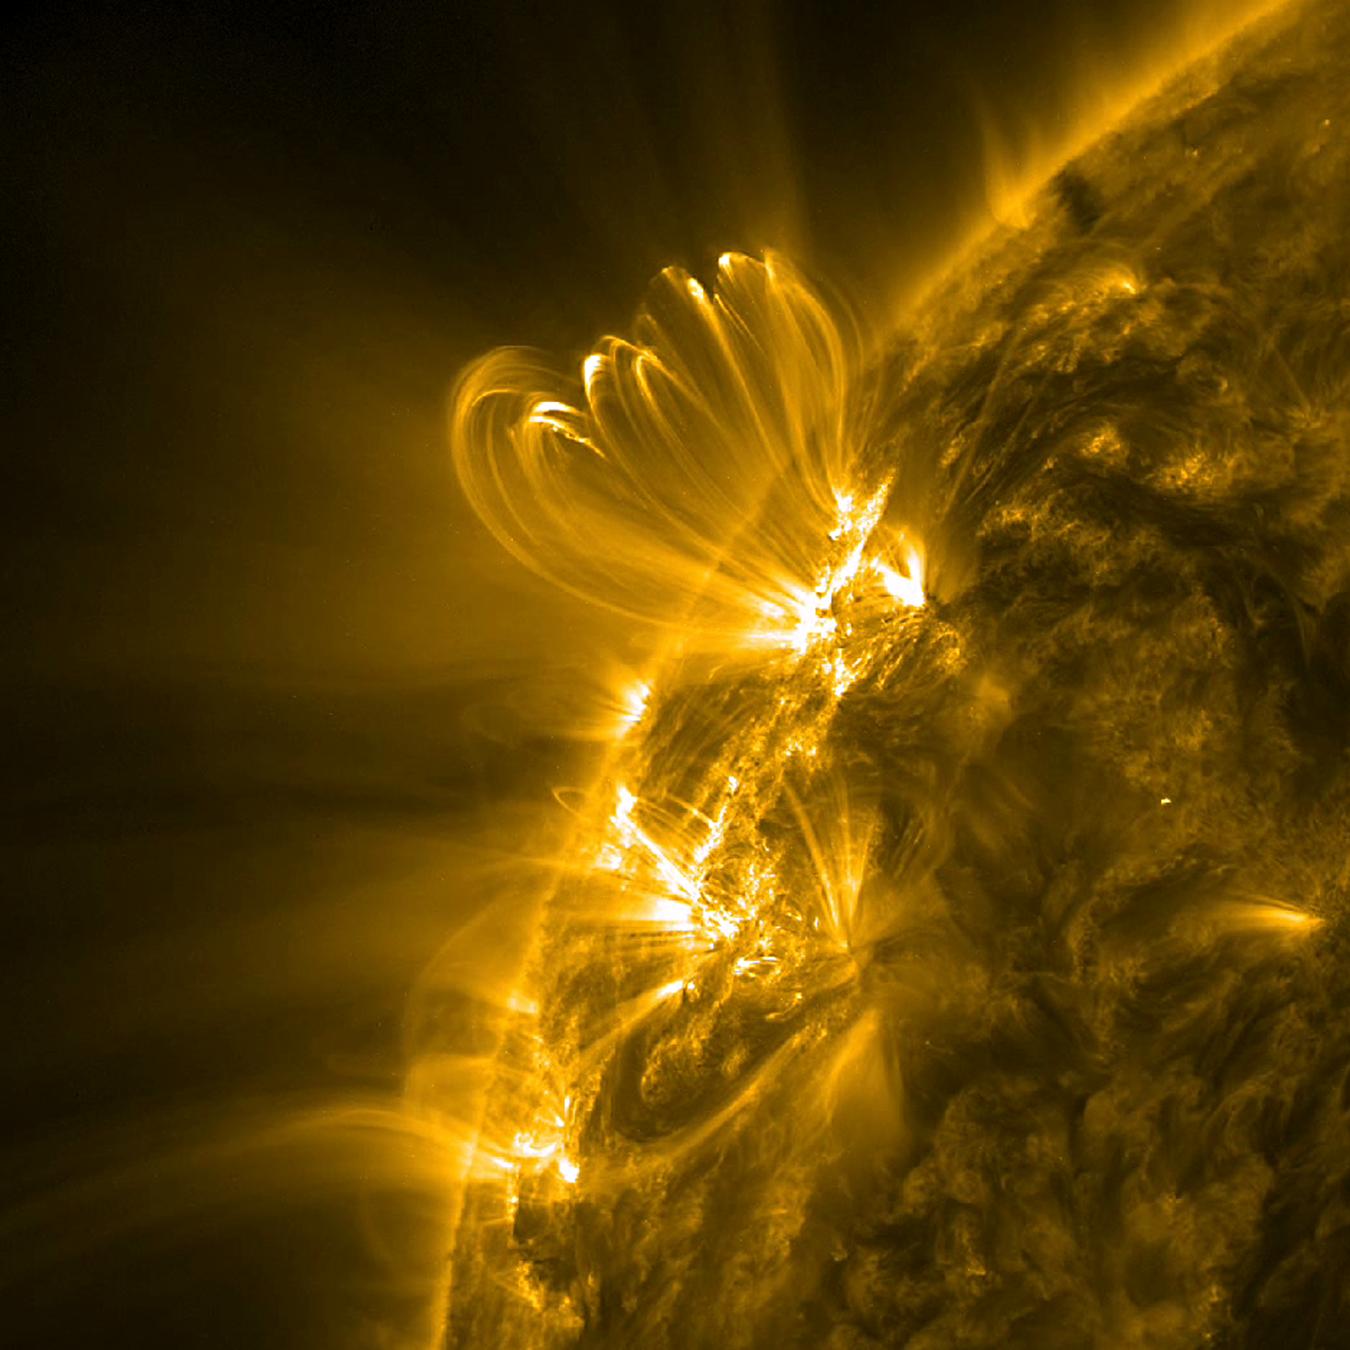
Flares are complicated events that are triggered by the reconnection of magnetic field lines. The dramatic reconnection event accelerates particles into the star’s atmosphere, heating many different layers that emit across the electromagnetic spectrum. Time-resolved spectroscopy is a unique tool for understanding the evolution of heating and cooling during stellar flares. Each emission line or continuum enhancement traces a different layer of the atmosphere, so we can estimate the changing temperatures and densities as the flare evolves.
Left panel: Diagram of the magnetic reconnection event responsible for Solar and stellar flares. The regions responsible for different types of emission are labeled. (credit:
C. T. Russell;
Gennady et al. 2015)
Right panel: Image of the Sun in UV light showing magnetic loops high above the surface. (credit:
NASA/SDO)
infrared emission lines
While flares are common on cool, red dwarfs, they are often difficult to observe because the hot flare emission is primarily observable in bluer wavelengths, while the cool stellar surface is more easily observed in redder and infrared wavelengths. To test if flares could be observed at infrared wavelengths, I monitored some of the most well-known flare stars with both optical photometry and infrared spectroscopy, looking for signs of emission during strong flares.
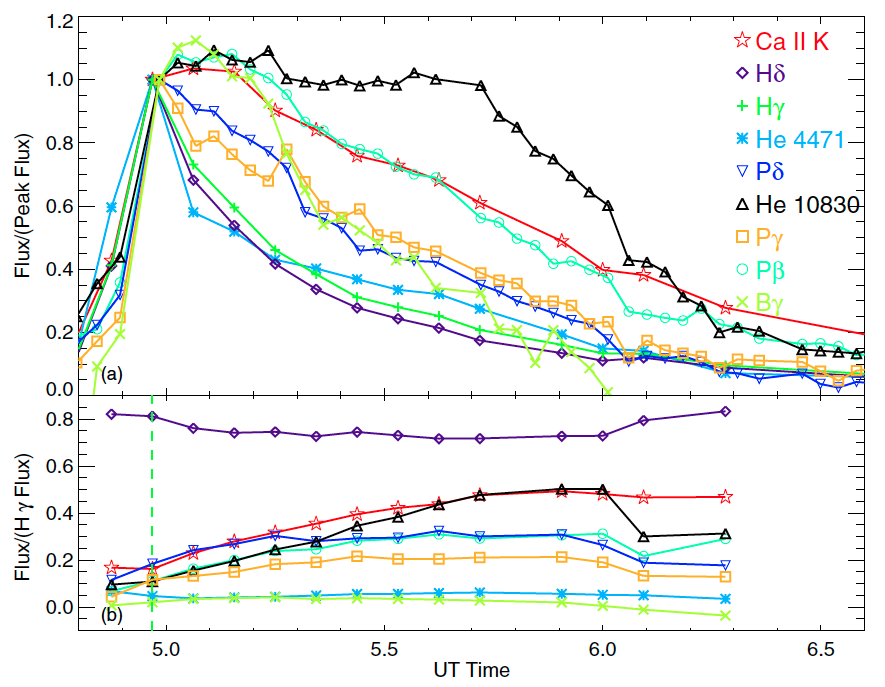
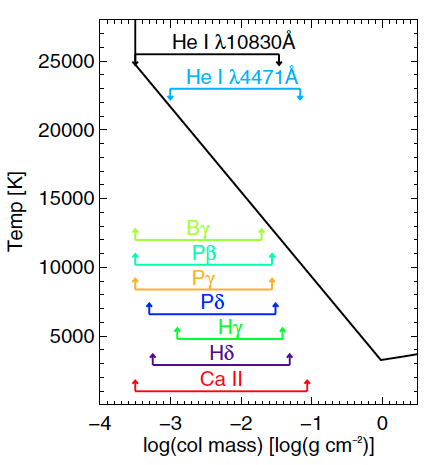
On the left, the evolution of emission lines detected throughout the optical and infrared spectrum. The lines that decline quickly cool the plasma efficiently, while those that continue to emit for longer trace regions of the flaring atmosphere that stay hotter longer. On the right, the layers of formation for emission lines in optical and infrared light. From
Schmidt et al. (2012).
With nearly 50 hours of monitoring, I found that infrared lines are only found in strong emission during the most powerful flares. With a simple 1D radiative transfer model, I also found that these infrared emission lines traced only the hottest, most diffuse portion of the flaring atmosphere. Infrared lines are not an efficient method for detecting flares, but they do provide a window into a less well-observed portion of the flaring atmosphere.
Balmer lines and the Balmer jump
I’ve also been involved in projects led by Adam Kowalski centered on spectroscopic flare monitoring in blue and UV spectra focused on examining the Balmer lines and the Balmer jump compared to thermal continuum. These two components are typically both present in flares, but more impulsive flares tend to have stronger atomic/balmer emission, while more gentle flares have more thermal continuum. As more data is obtained and models become more sophisticated, we can examine the range of heating mechanisms that generate flare emission.
-
The Near-ultraviolet Continuum Radiation in the Impulsive Phase of HF/GF-type dMe Flares. I. Data
Adam F. Kowalski, John P. Wisniewski, Suzanne L. Hawley, Rachel A. Osten, Alexander Brown, Cecilia Fariña, Jeff A. Valenti, Stephen Brown, Manolis Xilouris, Sarah J. Schmidt, and
1 more author
ApJ, Feb 2019
We present near-UV (NUV) flare spectra from the Hubble Space Telescope (HST)/Cosmic Origins Spectrograph during two moderate-amplitude U-band flares on the dM4e star GJ 1243. These spectra are some of the first accurately flux-calibrated, NUV flare spectra obtained over the impulsive phase in M dwarf flares. We observed these flares with a fleet of nine ground-based telescopes simultaneously, which provided broadband photometry and low-resolution spectra at the Balmer jump. An increase in the broadband continuum occurred with a signal-to-noise ratio >20 in the HST spectra, while numerous Fe II lines and the Mg II lines also increased but with smaller flux enhancements than the continuum radiation. These two events produced the most prominent Balmer line radiation and the largest Balmer jumps that have been observed to date in dMe flare spectra. A T = 9000 K blackbody underestimates the NUV continuum flare flux by a factor of two and is a poor approximation to the white light in these types of flare events. Instead, our data suggest that the peak of the specific continuum flux density is constrained to U-band wavelengths near the Balmer series limit. A radiative-hydrodynamic simulation of a very high energy deposition rate averaged over times of impulsive heating and cooling better explains the properties of the λ > 2500 Å flare continuum. These two events sample only one end of the empirical color-color distribution for dMe flares, and more time-resolved flare spectra in the NUV, U band, and optical from 2000 to 4200 Å are needed during more impulsive and/or more energetic flares.
-
Time-resolved Properties and Global Trends in dMe Flares from Simultaneous Photometry and Spectra
Adam F. Kowalski, Suzanne L. Hawley, John P. Wisniewski, Rachel A. Osten, Eric J. Hilton, Jon A. Holtzman, Sarah J. Schmidt, and James R. A. Davenport
ApJs, Jul 2013
We present a homogeneous analysis of line and continuum emission from simultaneous high-cadence spectra and photometry covering near-ultraviolet and optical wavelengths for 20 M dwarf flares. These data were obtained to study the white-light continuum components at bluer and redder wavelengths than the Balmer jump. Our goals were to break the degeneracy between emission mechanisms that have been fit to broadband colors of flares and to provide constraints for radiative-hydrodynamic (RHD) flare models that seek to reproduce the white-light flare emission. The main results from the analysis are the following: (1) the detection of Balmer continuum (in emission) that is present during all flares and with a wide range of relative contributions to the continuum flux at bluer wavelengths than the Balmer jump; (2) a blue continuum at flare maximum that is linearly decreasing with wavelength from λ = 4000-4800 Å, indicative of hot, blackbody emission with typical temperatures of T BB 9000-14, 000 K (3) a redder continuum apparent at wavelengths longer than Hβ (λ > 4900 Å) which becomes relatively more important to the energy budget during the late gradual phase. The hot blackbody component and redder continuum component have been detected in previous studies of flares. However, we have found that although the hot blackbody emission component is relatively well-represented by a featureless, single-temperature Planck function, this component includes absorption features and has a continuum shape strikingly similar to the spectrum of an A-type star as directly observed in our flare spectra. New model constraints are presented for the time evolution among the hydrogen Balmer lines and between Ca II K and the blackbody continuum emission. We calculate Balmer jump flux ratios and compare to the solar-type flare heating predictions from RHD models. The model ratios are too large and the blue-optical (λ = 4000-4800 Å) slopes are too red in both the impulsive and gradual decay phases of all 20 flares. This discrepancy implies that further work is needed to understand the heating at high column mass during dMe flares. Based on observations obtained with the Apache Point Observatory 3.5 m telescope, which is owned and operated by the Astrophysical Research Consortium.
-
Probing the Flare Atmospheres of M Dwarfs Using Infrared Emission Lines
Sarah J. Schmidt, Adam F. Kowalski, Suzanne L. Hawley, Eric J. Hilton, John P. Wisniewski, and Benjamin M. Tofflemire
ApJ, Jan 2012
We present the results of a campaign to monitor active M dwarfs using infrared spectroscopy, supplemented with optical photometry and spectroscopy. We detected 16 flares during nearly 50 hr of observations on EV Lac, AD Leo, YZ CMi, and VB 8. The three most energetic flares also showed infrared emission, including the first reported detections of Pβ, Pγ, He I λ10830, and Brγ during an M dwarf flare. The strongest flare (∆u = 4.02 on EV Lac) showed emission from Hγ, Hδ, He I λ4471, and Ca II K in the UV/blue and Pβ, Pγ, Pδ, Brγ, and He I λ10830 in the infrared. The weaker flares (∆u = 1.68 on EV Lac and ∆U = 1.38 on YZ CMi) were only observed with photometry and infrared spectroscopy; both showed emission from Pβ, Pγ, and He I λ10830. The strongest infrared emission line, Pβ, occurred in the active mid-M dwarfs with a duty cycle of 3%-4%. To examine the most energetic flare, we used the static NLTE radiative transfer code RH to produce model spectra based on a suite of one-dimensional model atmospheres. Using a hotter chromosphere than previous one-dimensional atmospheric models, we obtain line ratios that match most of the observed emission lines. Based on observations obtained with the Apache Point Observatory 3.5 m telescope, which is owned and operated by the Astrophysical Research Consortium.


